


This example demonstrates the impact of a highway close to Namur, Belgium.
In this case the speedway is a line source of emission.
Using MAESTRO to visualise the concentration field around a source, the only things you have to do are :
- To collect the information around the source
- To define the Topography around the source
- To define the Land Use around the source
- To calculate the Wind Field
1. General information around the site top
To collect the information around the source, MAESTRO may use a scanned road map representing an area of few kilometers to few tens of kilometers. The resolution may be adapted to domain extend and purpose (from 250 m to few kilometers)
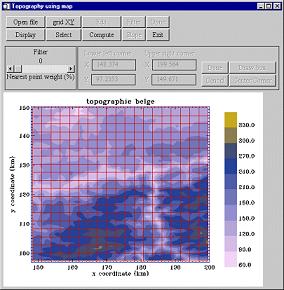
2. Topography definition around the site top
The topography is defined from the scanned road map using the drawn level lines or may be extracted from a database.
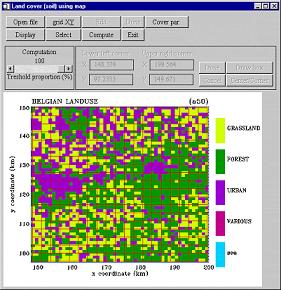
3. Land Use definition around the site top
The Land use is defined from the scanned road map. A distinction is made between water surface, urban area, forest and grassland surfaces.
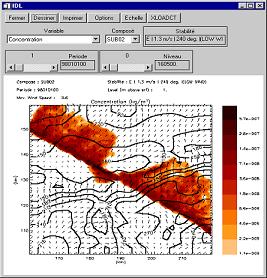
4. Wind Field calculation around the site top
MAESTRO computes the wind field over the 3D domain and
- Classical statistics : annual mean concentration, percentiles, deposits, ...
- Observation series reconstruction over dense networks Detection of critical situations (Meteorological & emissions)
top
Product of ATM-PRO sprl.